
The graphic language devised by Jacques Bertin is intended to be prescriptive, and it has made a name for itself in the field of cartography and information visualisation in France and the United States.
Aimed at producing comprehensible images at a lower “mental cost”, the system is based on the organisation of data, but also on an analysis of the effects of graphic signs on our perception. From this, Bertin developed rules - which he believed to be universal - for the visual processing of data.
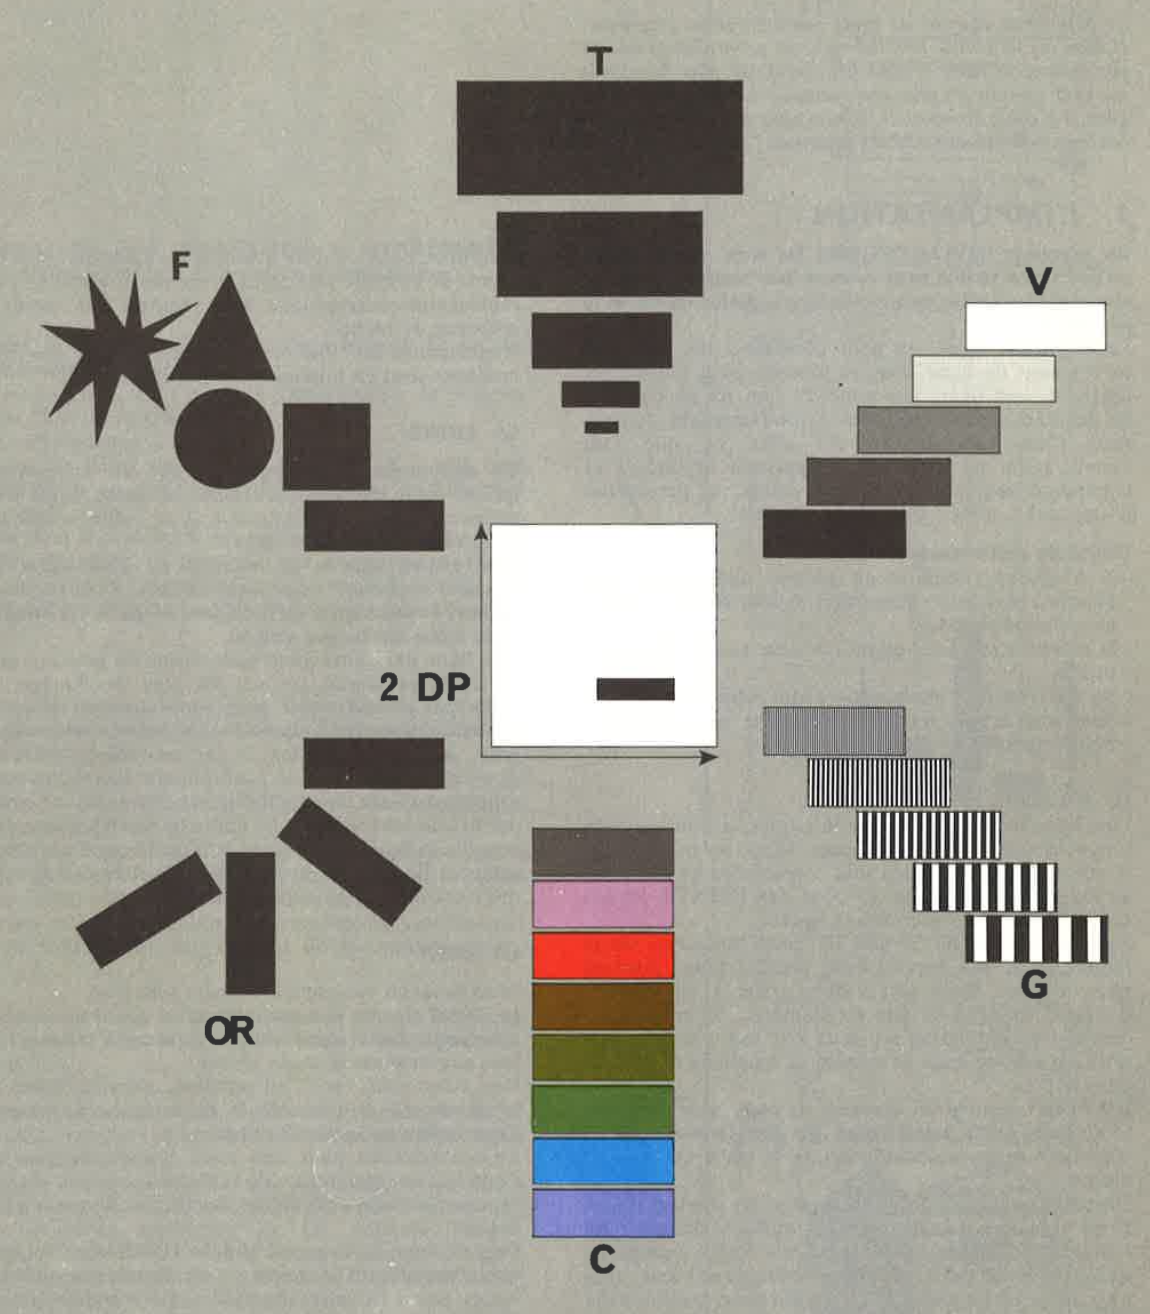
However, the technical nature of the method makes it difficult for non-specialists to learn. Occasional cartographers can, however, discover in this treatise the elementary rules of visual representation: depending on the effects produced by the size, value, grain, colour, orientation or shape of the elements represented on the plan, a map or diagram will be more or less effective.
The father of graphic semiology, according to the introduction to the first edition of the book, was calling for a genuine democratisation of (carto)graphic techniques:
The last public scribe disappeared from Paris in 1962. He was a witness to a time when reading and writing were not yet available to everyone. If everyone is now “literate”, it’s because the UNIVERSAL USE of writing has suddenly appeared. Learning to write was organised. A method and a grammar were established, and teaching it became compulsory.
But now the UTILITY of drawing has appeared. It is a convenient way of noting down, retaining and comparing the wealth of information needed to carry out a modern activity.
But few people know how to use drawings. Drawers and drawing offices play the role of public scribes and are overloaded with work. In the future, we have no doubt, useful drawing, starting with diagrams, will be within the reach of everyone, good or bad draughtsmen, because the problem is similar to that of writing.
Everyone writes and uses this means of expression in the course of their lives, without being a “writer”. Similarly, everyone will know how to use the two dimensions of a sheet of paper to formulate information, having learnt the rules of use rather than technique. Anyone who has attended school will know how to construct an image, regardless of the quality of the pen stroke, just as they know how to construct a sentence, regardless of the calligraphy of the words. We no longer confuse language with writing, turn of phrase with calligraphy. But we still confuse the construction of an image with the quality of the line. How many admirably executed and richly reproduced drawings betray their title and communicate only unimportant and useless information? What a waste of paper and colour. On the other hand, “clumsy” but correctly constructed sketches become the best tools for discovery and teaching.
Do we really know how to look at a drawing and answer the question: what purpose can a drawing serve? This is the question we will try to answer, and the consequences of this answer will be developed into a practical method for using and drawing up graphic representations.
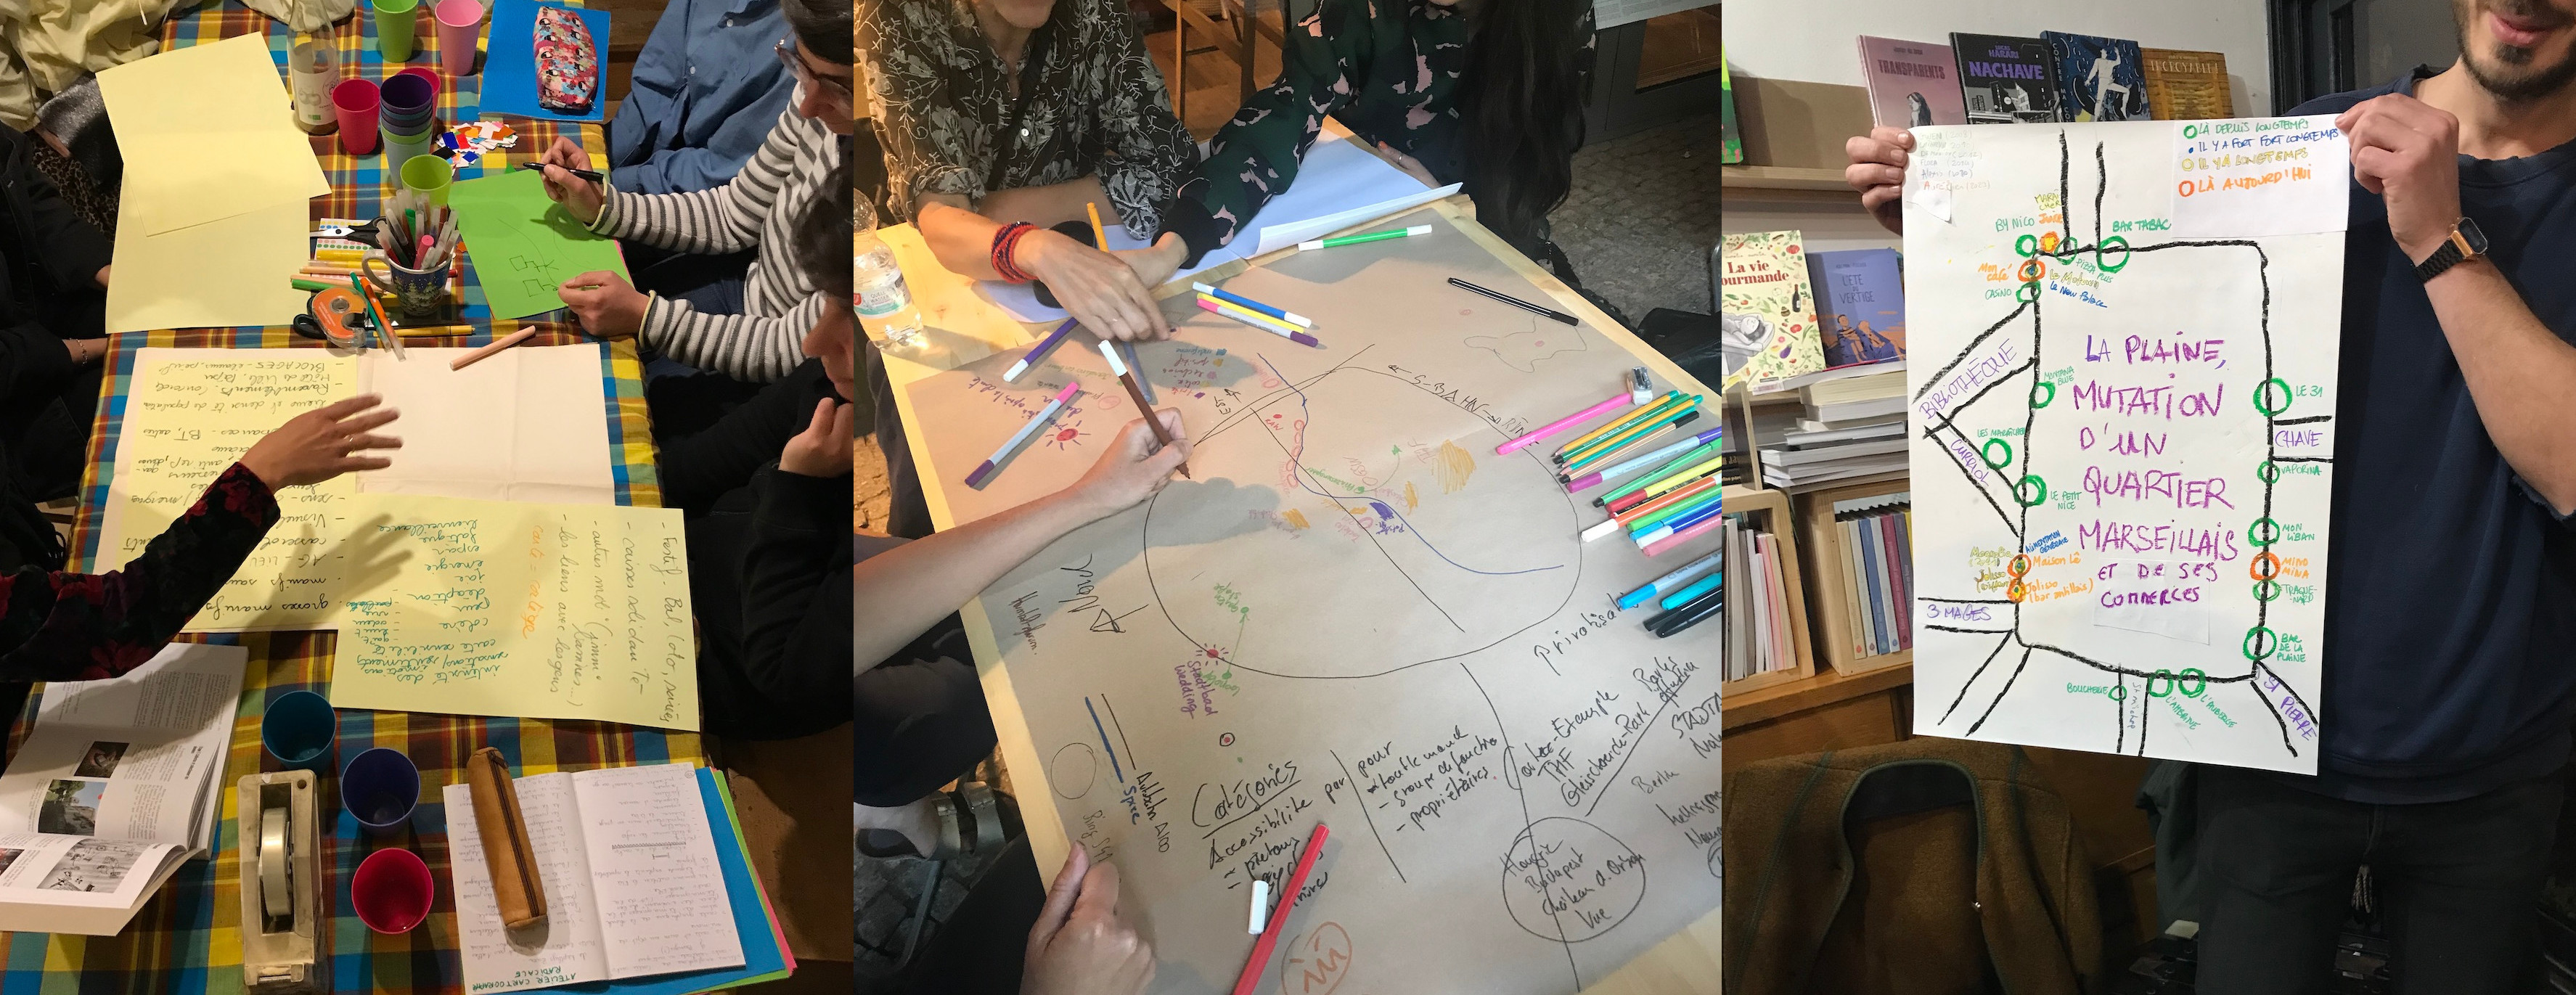
Today, the map seems to have been ’democratised’, particularly through its digital use, making it a familiar tool in everyday life. At the same time, we are seeing the emergence of critical cartography, often practised by non-mapmakers who are learning to appropriate its techniques. These people make their own maps on subjects they know well because they concern their own living space. Whether produced individually or as part of collective or participatory workshops, these maps give substance to neglected and new information. In this way, the map becomes a tool for citizens’ struggles: a radical map. [2]
Isn’t this the civic use of cartography that Jacques Bertin was calling for ? In the book’s conclusion, we read:
Indeed, every school-educated individual spends some 5,000 hours learning verbal expression. He learns for some 500 hours to reproduce a pot, a table or an anatomy. He does not spend a moment learning graphic expression, i.e. seeing, drawing and predicting the transformation of individuals and things in the midst of which he will struggle for sixty years.
One day, everyone will make maps: counter-maps, radical maps, sensitive, experimental, informal maps, maps for oneself and maps for others, maps to understand and defend one’s own use of space... without necessarily being a professional cartographer.
